The weather EFB for pilots

All the weather of the flight,
on one map.

Met2Pilot is a weather EFB for pilots: the European radar composite, convective cells, cloud tops, decoded METAR and TAF, NOTAM, upper winds and a vertical cross-section along the route — in one place, on the iPad, in flight. It is a situational awareness aid, not a weather briefing.

One month free · works in any browser · installs to your home screen

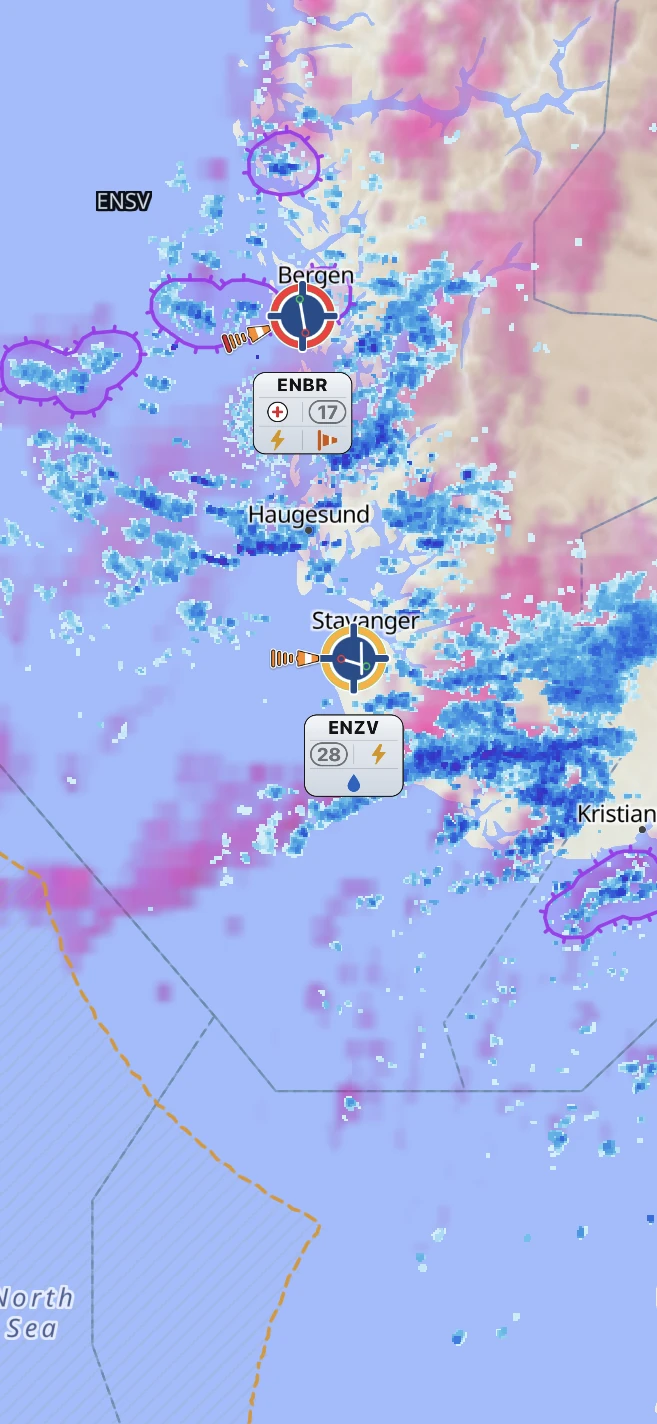
Met2Pilot in flight over Norway: radar composite, and the airfield rings showing Bergen red, Stavanger amber and Oslo green

Not certified

Met2Pilot is a situational awareness aid. It is not a primary source: data is supplied by third parties and may be delayed, incomplete or incorrect. It replaces neither the official weather briefing nor onboard equipment. Flight preparation and conduct remain the sole responsibility of the pilot in command.

Concretely: the traffic shown is not a TCAS and is not for avoidance; the ICAO chart is a preview and is not for navigation; the turbulence layer is experimental. These reservations are written inside the application, next to each function concerned, and not relegated to a terms page.

The radar mosaic is published 7 to 12 minutes late, bridged by extrapolation where available — that is a forecast, and it is announced as one.

What it shows

Real sources, named, with their age always on screen.

Six groups, thirty shipped functions. Each one says where it comes from.

The weather now

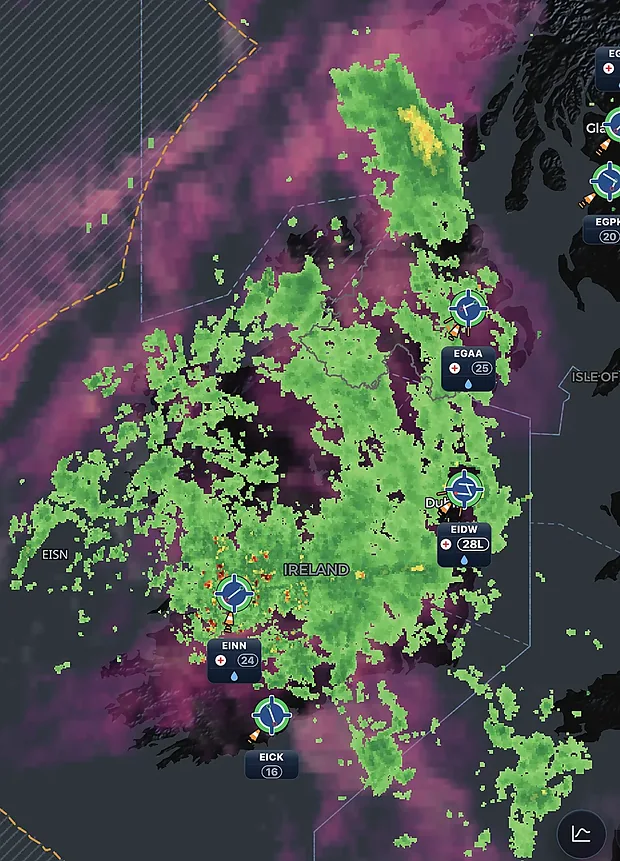
The European radar composite in motion, precipitation where it does not reach, lightning and fronts — here over Florence, with the field's bulletin.

  • European OPERA radar composite (EUMETNET) — reprojected reflectivity, classified palette, adjustable threshold. Product refreshed every 5 minutes.
  • NOAA / ERR precipitation — infrared satellite estimate, every 10 minutes, where radar does not reach.
  • Cloud tops and convection (EUMETSAT) — the height of the cloud ceiling, as a layer.
  • RDT convective cells — phase, movement, age and top of each cell, at a touch.
  • Lightning, fronts, anvils, new cells — the layers that say where it is forming, not only where it is falling.
  • The top of a rain area, at a touch — touch a precipitation area and it returns its highest flight level.
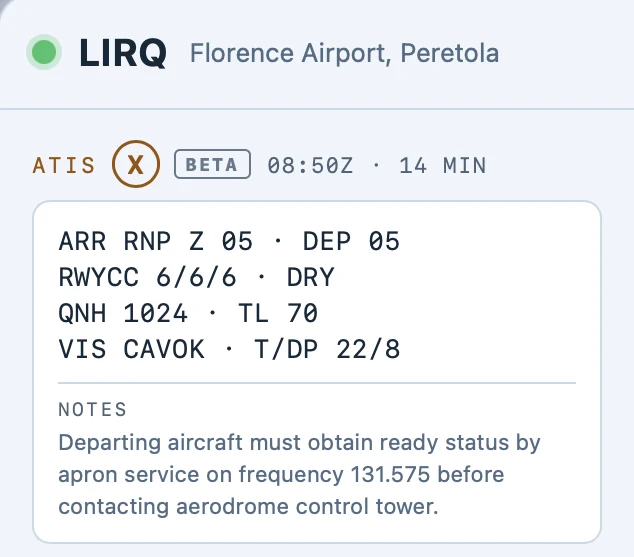
Florence ATIS bulletin, called on the phone line and decoded
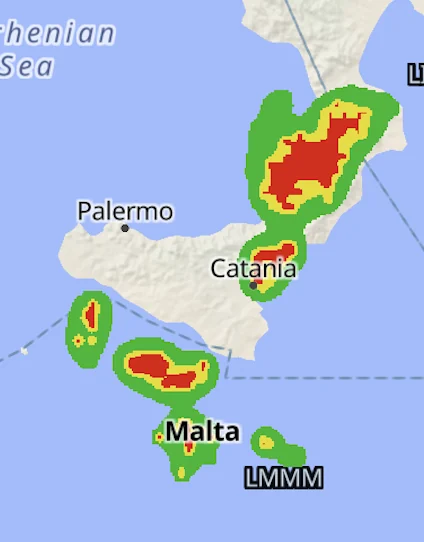
Onboard radar view Onboard radar view: the radar composite in four colours, green to red, over Sicily and Malta

SIGMET & PIREP

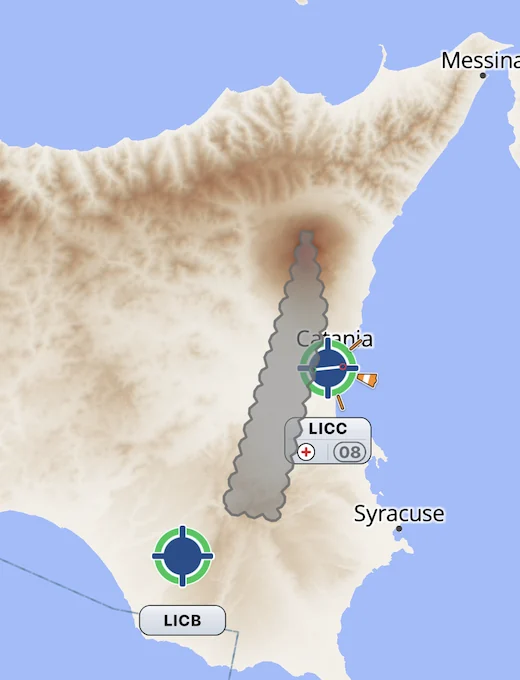
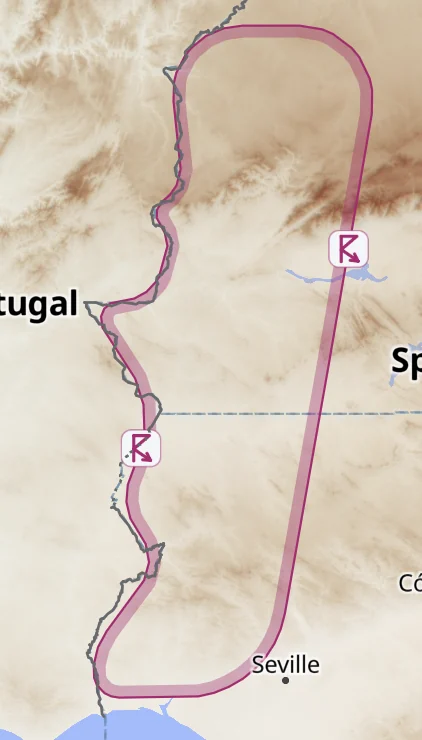
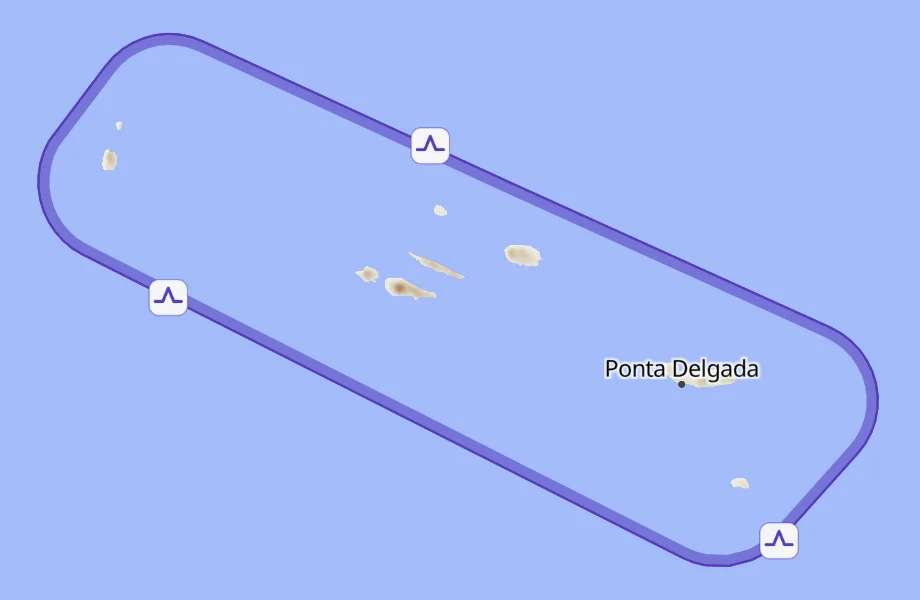
The official warnings, and what crews actually met: Etna ash, thunderstorms over Spain, turbulence around the Azores, and a PIREP at its level.

  • SIGMETs worldwide — thunderstorm, turbulence, icing, mountain wave, tropical cyclone, outlined like airspace on a chart, without hiding the radar.
  • TEMSI symbols along the edge — a touch opens the card in plain words: top, layer, movement, trend, validity, FIR and the raw text.
  • Volcanic ash — the ash SIGMET drawn as a grey cloud, with its top and its movement.
  • Turbulence PIREPs — reported by crews over the last two hours, within 4,000 ft of your level, fading with age. Few over Europe.
Volcanic ash SIGMET: the Etna plume as a grey cloud down to Catania Thunderstorm SIGMET over western Spain, from the Portuguese border to Seville Turbulence SIGMET around the Azores, its symbol repeated along the edge PIREP: turbulence reported by a crew at FL350

The weather next

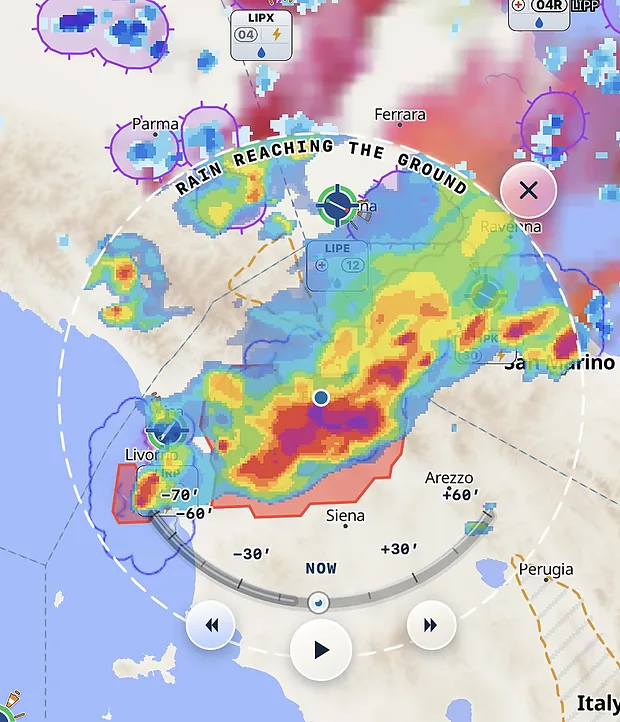
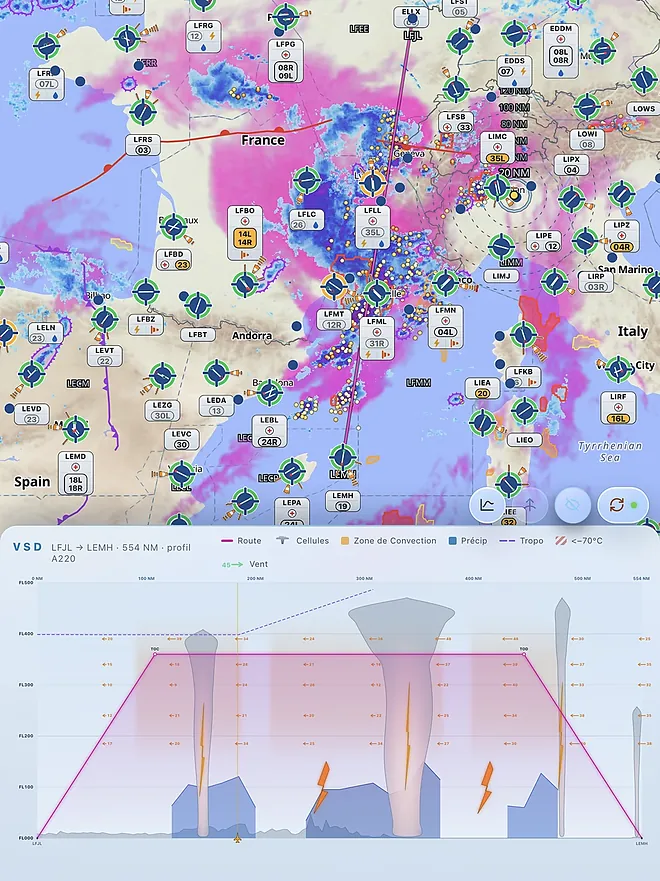
What is coming within the hour: a watch disc around the field, the wind at the chosen level, and the vertical cut along the route.

  • 60 NM precipitation watch — a disc around the field, from −60 to +60 minutes, by Lagrangian extrapolation of the radar field. Italy for now.
  • Upper winds — the wind grid at the chosen flight level, from the surface to FL500.
  • Vertical cross-section along the route — terrain, precipitation and isotherms in the plane of the flight.
  • Wind profile and equal-time points — the wind met along the route, and the ETP between two diversion fields.
Precipitation watch over LIRQ, from −60 to +60 minutes Vertical cut along the route
Wind at CRZ FL

The field

The field as it is right now: raw METAR and TAF, runway in use deduced from traffic, and the real runway geometry.

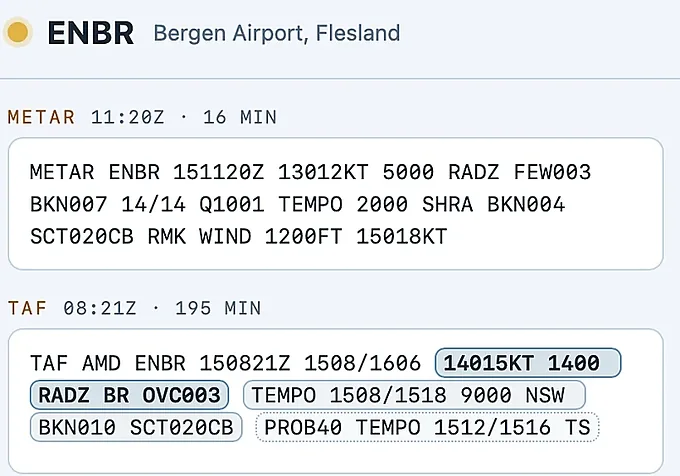
  • Decoded METAR and TAF — the raw message and its plain reading, with the age of the report.
  • Runway diagram, QFU and wind components — the real geometry of the field, headwind and crosswind computed runway by runway.
  • Runway in use — inferred from low-altitude ADS-B traffic, not guessed from the wind.
  • NOTAM — per field, sorted by type, with their decoding.
  • Network by airline — the map carries only the fields your airline serves.
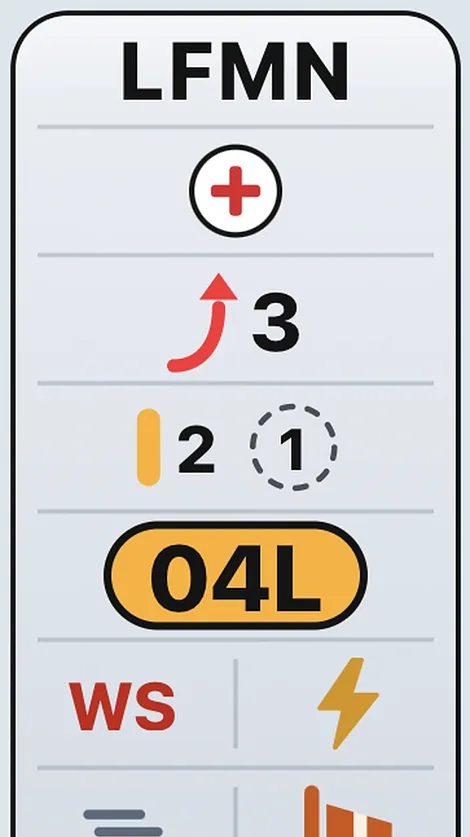
Airfield label: hospital, go-arounds, runway in use, windshear ENBR panel: raw METAR and TAF with the age of the report

ATIS, even without D-ATIS Beta

At fields with no D-ATIS, the message exists only on a phone line. Met2Pilot calls it, transcribes it, and picks out what must not be missed.

  • French fields without D‑ATIS — and LIRQ (Florence). Where the bulletin goes out on a phone line and nowhere else.
  • The call is made for you — the spoken message is called, recorded, then turned into text.
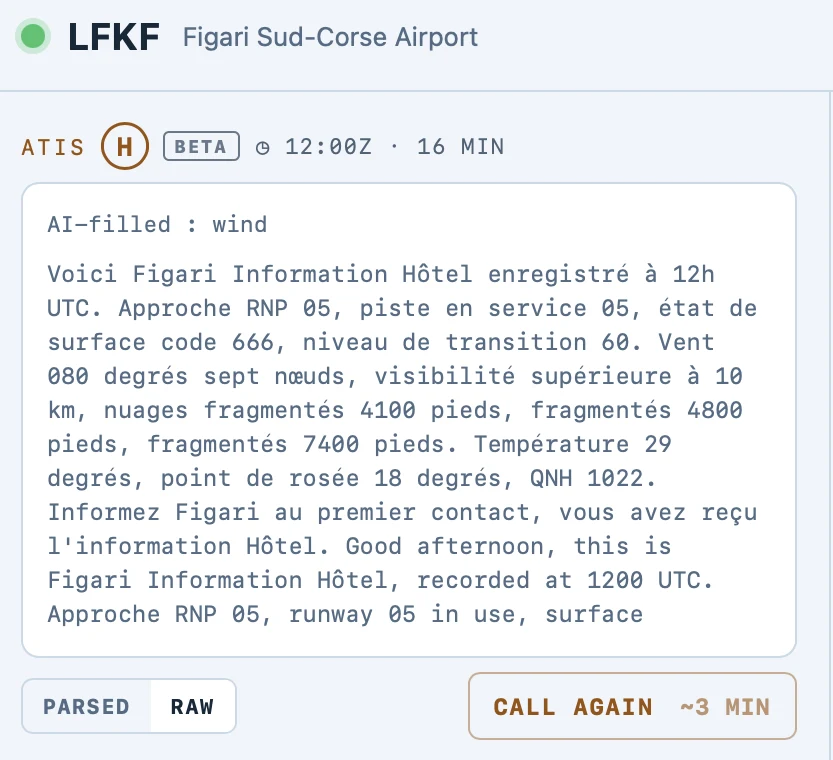
  • The raw line, word for word — the full transcript stays readable, with nothing cut.
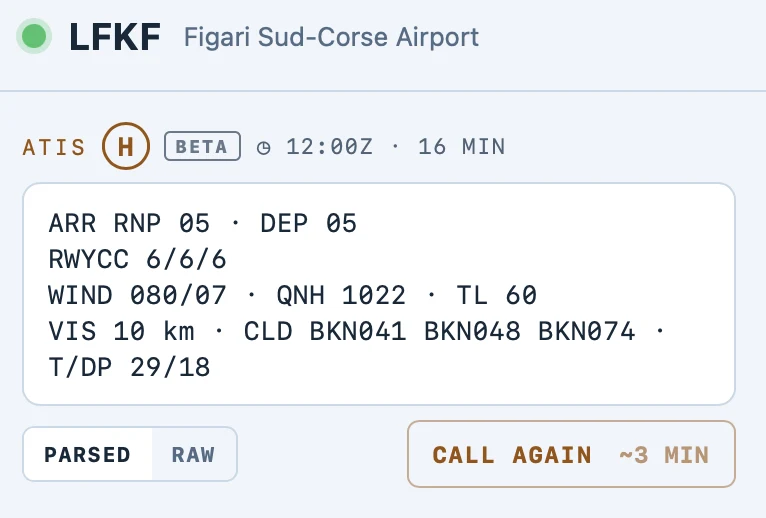
  • Decoded and sorted — arrival, departure, runway in use, runway condition, wind, QNH, transition level.
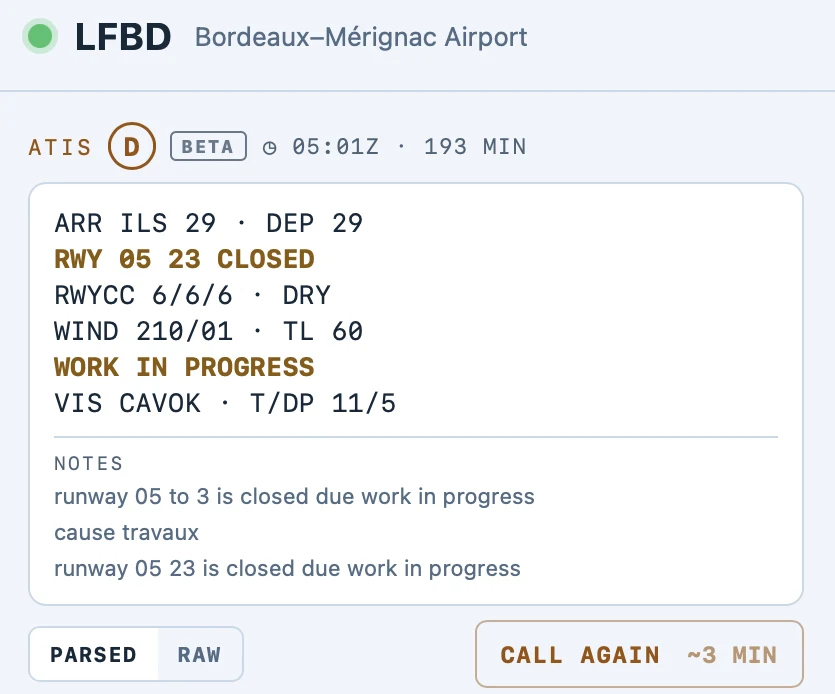
  • What must not be missed, pulled from the text — runway closed, work in progress. In beta — this option will move to a paid plan.
Bordeaux ATIS, letter D, decoded: runway 05/23 closed, work in progress The Figari message transcribed word for word, in French then in English The same message decoded: arrival, departure, runway condition, wind, QNH

Around the aircraft

Your position, your route, and what the others are doing — with or without GPS on board.

  • Three position sources — the device GPS, your ADS-B callsign, or a point placed by hand.
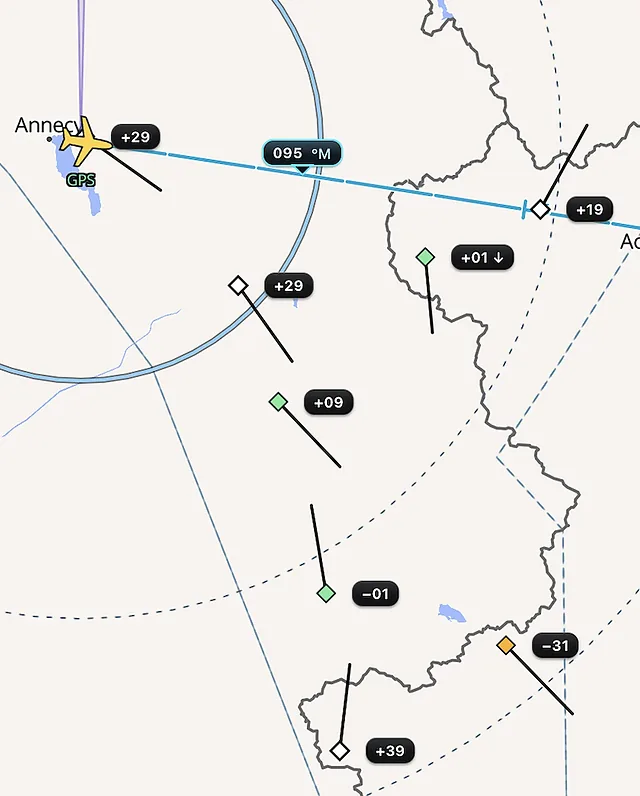
  • Range rings, speed vector, track-up — the true magnetic track, variation included.
  • Measuring cord and radial — a distance, a bearing, without leaving the map.
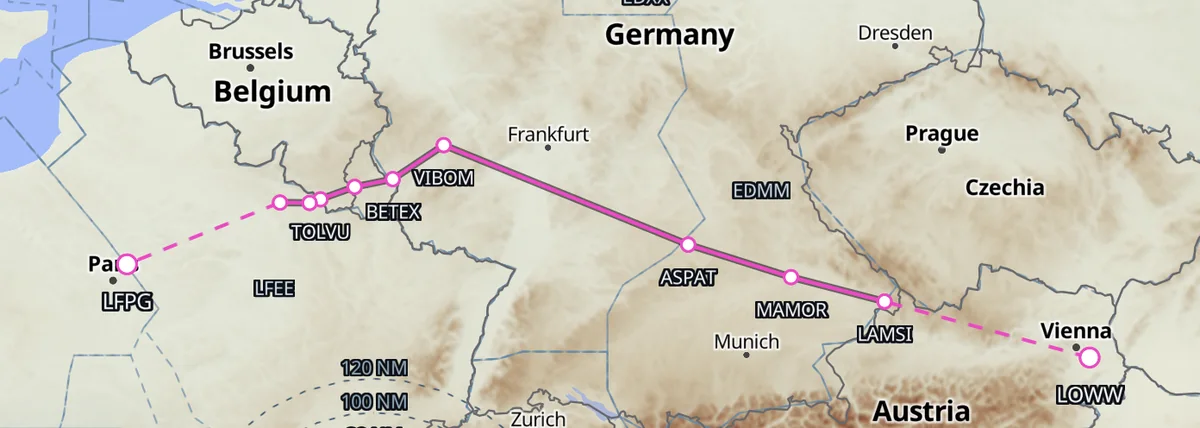
  • Pasted ATC or OFP route — the route text becomes a polyline on the map.
  • ADS-B traffic — preview, not TCAS.
  • ICAO VFR chart (open flightmaps) — preview, not for navigation.
Surrounding traffic, relative level and recent tracks
Route from LFPG to LOWW drawn across Europe with its waypoints Import your route

Built for the flight deck

Built for the flight deck: full screen on the iPad, cached basemap, and two colour sets that are not the inverse of one another.

  • Full screen on iPad — installable on the home screen, the screen stays awake.
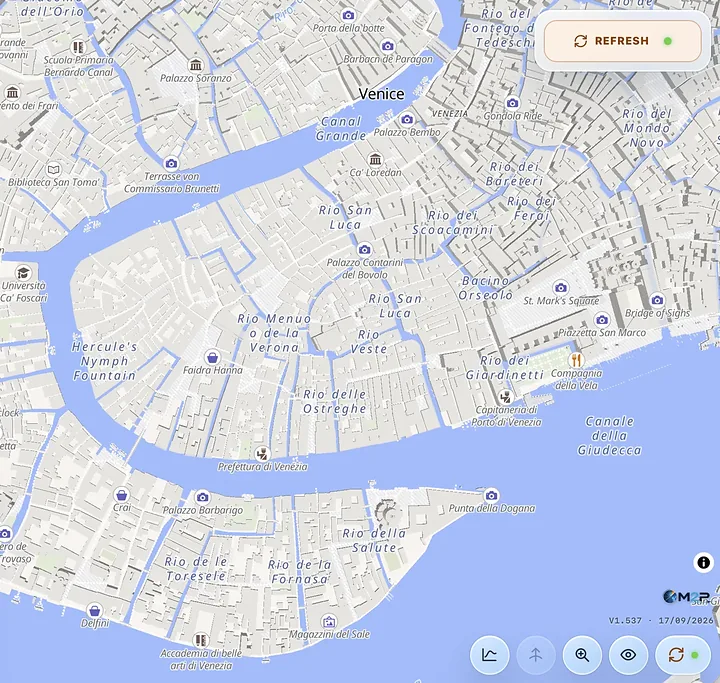
  • Cached base map — terrain and coastline stay there when the connection drops.
  • Day and night — two colour sets, not an inversion.
  • LINE and GA modes — airline transport and general aviation share neither the same fields nor the same thresholds.
The same map in the night theme High-definition ground map, Venice

What you see at a glance

What reads without a click: each layer's age, where each figure comes from, and a hold marked where it is being flown.

  • The age of every layer — shown next to its name at all times. Stale data withdraws rather than ageing in silence.
  • The provenance of every figure — “measured” or “model” is written next to the number, because the two look alike and are not worth the same.
  • No trackers — no Google Analytics, no Matomo, no advertising cookie. Usage measurement is internal, anonymised, and can be declined with one switch.
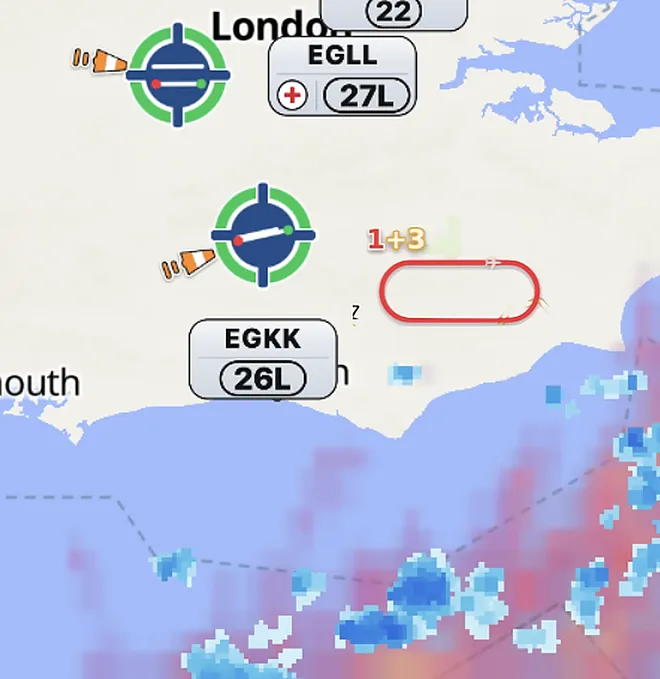
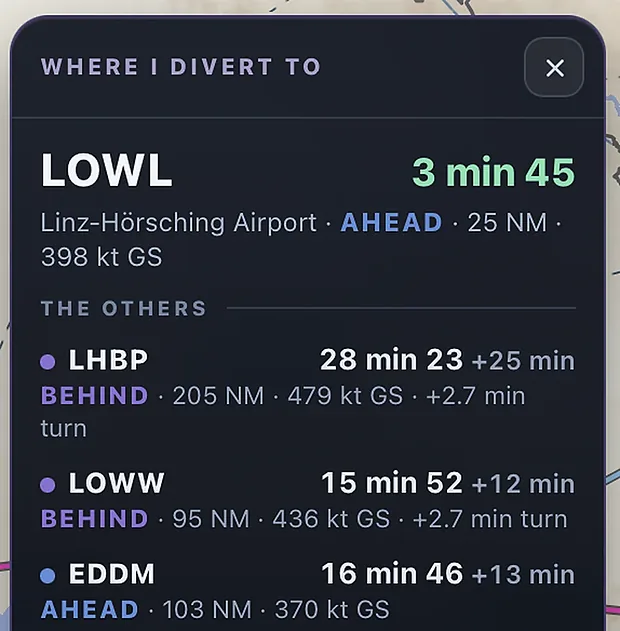
A hold south-east of Gatwick, red ring on an emergency in progress Diversions ranked by time to reach

Where the data comes from

Every layer is named, and says what it does not measure.

  • EUMETNET OPERA

    for the European radar composite

  • NOAA (NODD programme)

    for the ERR precipitation estimate

  • EUMETSAT

    for cloud tops, convection and RDT cells

  • Open-Meteo (commercial plan)

    for upper winds, the vertical cross-section and the route profile

  • DWD

    for fronts

  • Italian Civil Protection (Radar-DPC, CC BY-SA 4.0)

    for the precipitation watch

  • adsb.lol (ODbL)

    for traffic and runway in use

  • open flightmaps

    for the ICAO VFR chart.

Attribution for each source is carried permanently by the map's attribution control.

Questions

What we get asked most.

Does Met2Pilot replace the weather briefing?

No, and it does not try to. It is a situational-awareness aid, not certified. The official weather briefing, the flight documentation and the on-board equipment remain the reference; Met2Pilot is there to help you ask a better question, not to answer it for you.

What does it run on?

Any recent browser. It is built for the iPad as an EFB: installable on the home screen, full screen, display kept awake. Nothing to download from an app store.

What happens when the link drops in flight?

The basemap and terrain of the pre-cached area stay on screen. The weather data stops refreshing — and you can see it: each layer’s age is shown at all times, and a layer that gets too old removes itself rather than ageing silently.

My iPad has no GPS. Does it still work?

Yes. Three position sources: the device GPS when there is one, your ADS-B call sign — you type it, the aircraft is found — or a point placed by hand on the map, which stays where you put it.

Is the data real time?

No, and nobody’s is. The European radar mosaic is published seven to twelve minutes late. The application shows that delay instead of hiding it, and fills the gap by extrapolation where it can — while saying that this is a forecast.

Is the traffic shown a TCAS?

No. It is ground-collected ADS-B, for situational awareness, and it serves neither separation nor avoidance. What it really gives you: seeing that everyone ahead has taken the same detour around a cell.

What is recorded about me?

Your email address, your usage profile and your airline. Your GPS position stays on the device: it is neither recorded nor retained. No advertising tracker, no third-party audience measurement. The internal usage metering counts actions, never places, and can be switched off.

How do I sign up, and what does it cost?

An email address and a six-digit code — no password. Then one month of trial, with the payment method collected at sign-up, and an annual subscription after that: 29 € a year for the first 50 subscribers, 39 € beyond. The amount actually charged is shown on the subscription screen, where it is read from the payment provider — so that no page can announce anything other than what will be taken.
Pricing

One month free, then 29 € a year.

The payment method is collected at sign-up; nothing is charged during the trial. Here is the plan, and where the money goes.

1 month free trial

then

29 €per year

First 50 subscribers
Area coveredLarge Europe

The founder rate is earned when the account is created and is not taken back. Beyond the first 50, the annual subscription is 39 €. The amount actually charged is shown on the subscription screen, read from the payment provider — and the terms of use prevail.

Where the money goes

  • Quality data, from official meteorological sourcesEUMETSAT, EUMETNET OPERA, NOAA, Deutscher Wetterdienst. Each is named, with what it measures — and what it does not.
  • Those feeds are meteredEvery map you open is billed to us. That is the single largest line of the bill.
  • No ads, no data resaleNo third-party trackers, no audience measurement. Nothing about you is the product.
  • Your account stays in the EUDatabase in Frankfurt, servers in Germany.

Getting started

An email address, a six-digit code, no password.